The economy of India has transitioned from a mixed planned economy to a mixed middle-income developing social market economy with notable public sector in strategic sectors. From independence in 1947 until 1991, successive governments followed the Soviet model and promoted protectionist economic policies, with extensive Sovietization, state intervention, demand-side economics, natural resources, bureaucrat-driven, and financial regulation. Since the start of the 21st century, annual average GDP growth has been 6% to 7%.
Nearly 70% of India’s GDP is driven by domestic consumption; the country remains the world’s fourth-largest consumer market. Besides private consumption, India’s GDP is fueled by government spending, investments, and exports. In 2022, India was the world’s 8th-largest importer and the 10th-largest exporter. India has been a member of the World Trade Organization since 1 January 1995. With 476 million workers, the Indian labor force is the world’s second-largest. India has one of the world’s highest billionaires and extreme income inequality.
In 2021–22, India’s foreign direct investment (FDI) was $82 billion. The leading sectors for FDI inflows were the service, computer, and telecom industries. India has free trade agreements with several nations and blocs, including ASEAN, SAFTA, Mercosur, South Korea, Japan, Australia, UAE, and several others which are in effect or under the negotiating stage.
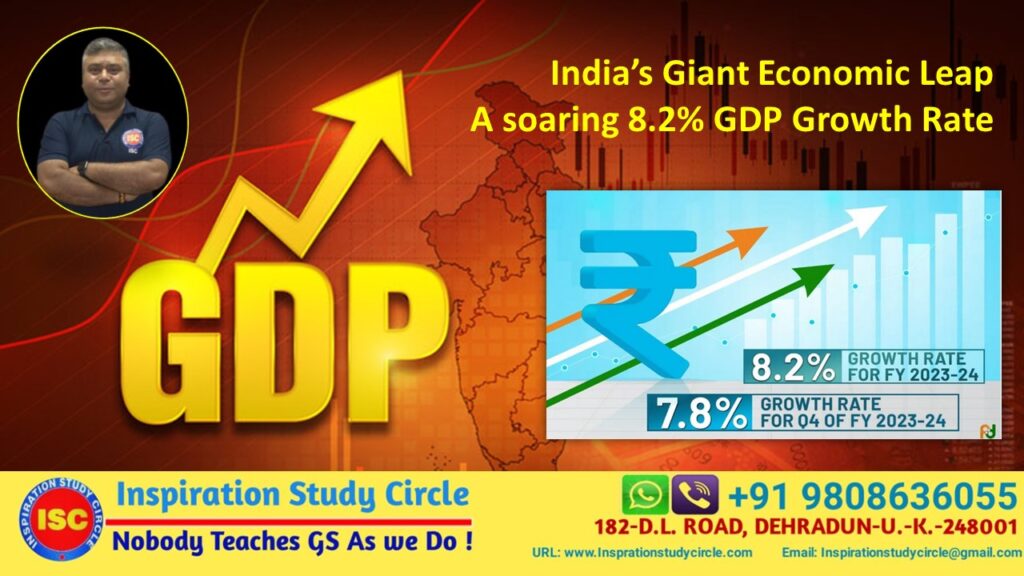
The service sector makes up more than 50% of GDP and remains the fastest growing sector, while the industrial sector and the agricultural sector employ a majority of the labor force. The Bombay Stock Exchange and National Stock Exchange are some of the world’s largest stock exchanges by capitalization. Nearly 65% of India’s population is rural and contributes about 50% of India’s GDP. India’s gross domestic savings rate stood at 29.3% of GDP in 2022. In recent years, independent economists and financial institutions have accused the government of manipulating various economic data, especially the GDP growth rate.
India was one of the richest countries in the world, for about two and a half millennia starting around the end of the 1st millennium BC and ending around the beginning of British rule in India.
Around 500 BC, the Mahajanapadas minted punch-marked silver coins. The period was marked by intensive trade activity and urban development.
By 300 BC, the Maurya Empire had united most of the Indian subcontinent including Tamilakam, which was ruled by Three Crowned Kings. The resulting political unity and military security allowed for a common economic system and enhanced trade and commerce, with increased agricultural productivity.
The Maurya Empire was followed by classical and early medieval kingdoms, including the Cholas, Pandyas, Cheras, Guptas, Western Gangas, Harsha, Palas, Rashtrakutas, and Hoysalas. The Indian subcontinent had the largest economy of any region in the world for most of the interval between the 1st and 18th centuries. From 1-1000 AD India constituted roughly 30% of the world’s GDP. In the year 1000, Maddison estimates 28.5% of the world’s population lived in India.
India experienced per-capita GDP growth in the high medieval era, coinciding with the Delhi Sultanate. By the late 17th century, most of the Indian subcontinent had been reunited under the Mughal Empire, which for a time again became the largest economy and manufacturing power in the world, producing about a quarter of global GDP, before fragmenting and being conquered over the next century. Bengal Subah, the empire’s wealthiest province, which solely accounted for 40% of Dutch imports outside the West, had an advanced, productive agriculture, textile manufacturing, and shipbuilding, in a period of proto-industrialization.
India experienced deindustrialization and cessation of various craft industries under British rule, which along with fast economic and population growth in the Western world, resulted in India’s share of the world economy declining from 24.4% in 1700 to 4.2% in 1950, and its share of global industrial output declining from 25% in 1750 to 2% in 1900. Due to its ancient history as a trading zone and later its colonial status, colonial India remained economically integrated with the world, with high levels of trade, investment, and migration.
From 1850 to 1947, India’s GDP in 1990 international dollar terms grew from $125.7 billion to $213.7 billion, a 70% increase, or an average annual growth rate of 0.55%. This was a higher rate of growth than during the Mughal era (1600–1700) when it had grown by 22%, an annual growth rate of 0.20%, or the longer period of mostly British East Indian company rule from 1700 to 1850 where it grew 39%, or 0.22% annually. However, by the end of British rule, India’s economy represented a much smaller proportion of global GDP. In 1820, India’s GDP was 16% of the global GDP. By 1870, it had fallen to 12%, and by 1947 to 4%. The Republic of India, founded in 1947, adopted central planning for most of its independent history, with extensive public ownership, regulation, red tape, and trade barriers. After the 1991 economic crisis, the central government began the liberalization.
Economic liberalization in India was initiated in 1991 by Prime Minister P. V. Narasimha Rao and his then-Finance Minister Dr. Manmohan Singh.
Economic liberalization in India since the 1990s led to a paradigm shift in the growth and structure of national income. Real GDP per capita grew 142 percent during 1994–2013.
About one-fourth of the national population was urban by 2000.
Service markets which would enjoy a much lighter burden of regulation and other obstacles became more successful than still-regulated sectors. For example, world-famous business process services are very lightly regulated.
The Indian steel industry began expanding into Europe in the 21st century. The government started the Golden Quadrilateral road network connecting Delhi, Chennai, Mumbai, and Kolkata with various Indian regions. The project, completed in January 2012, was the most ambitious infrastructure project of independent India.